
888-529-0707 call 24-7 we service throughout california
Stockton Motorcycle Accident Statistics and Common Causes
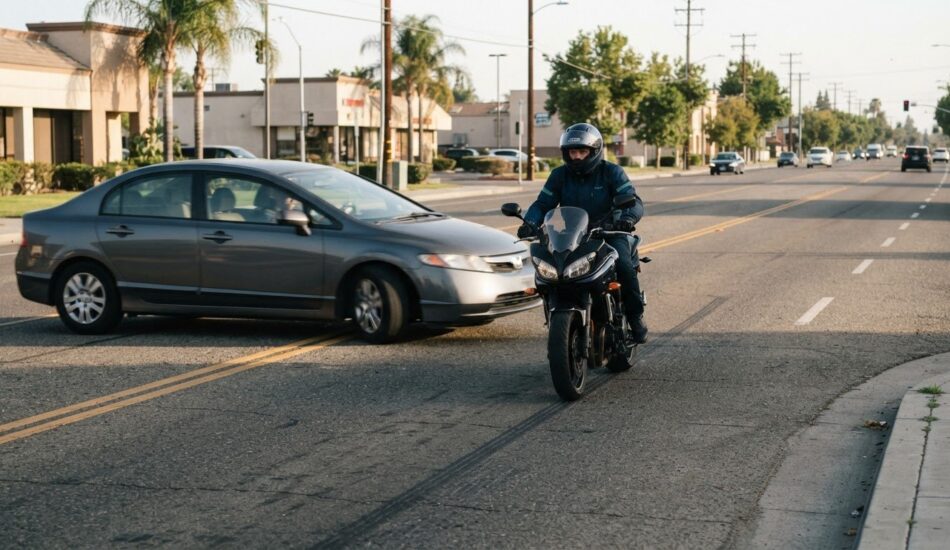
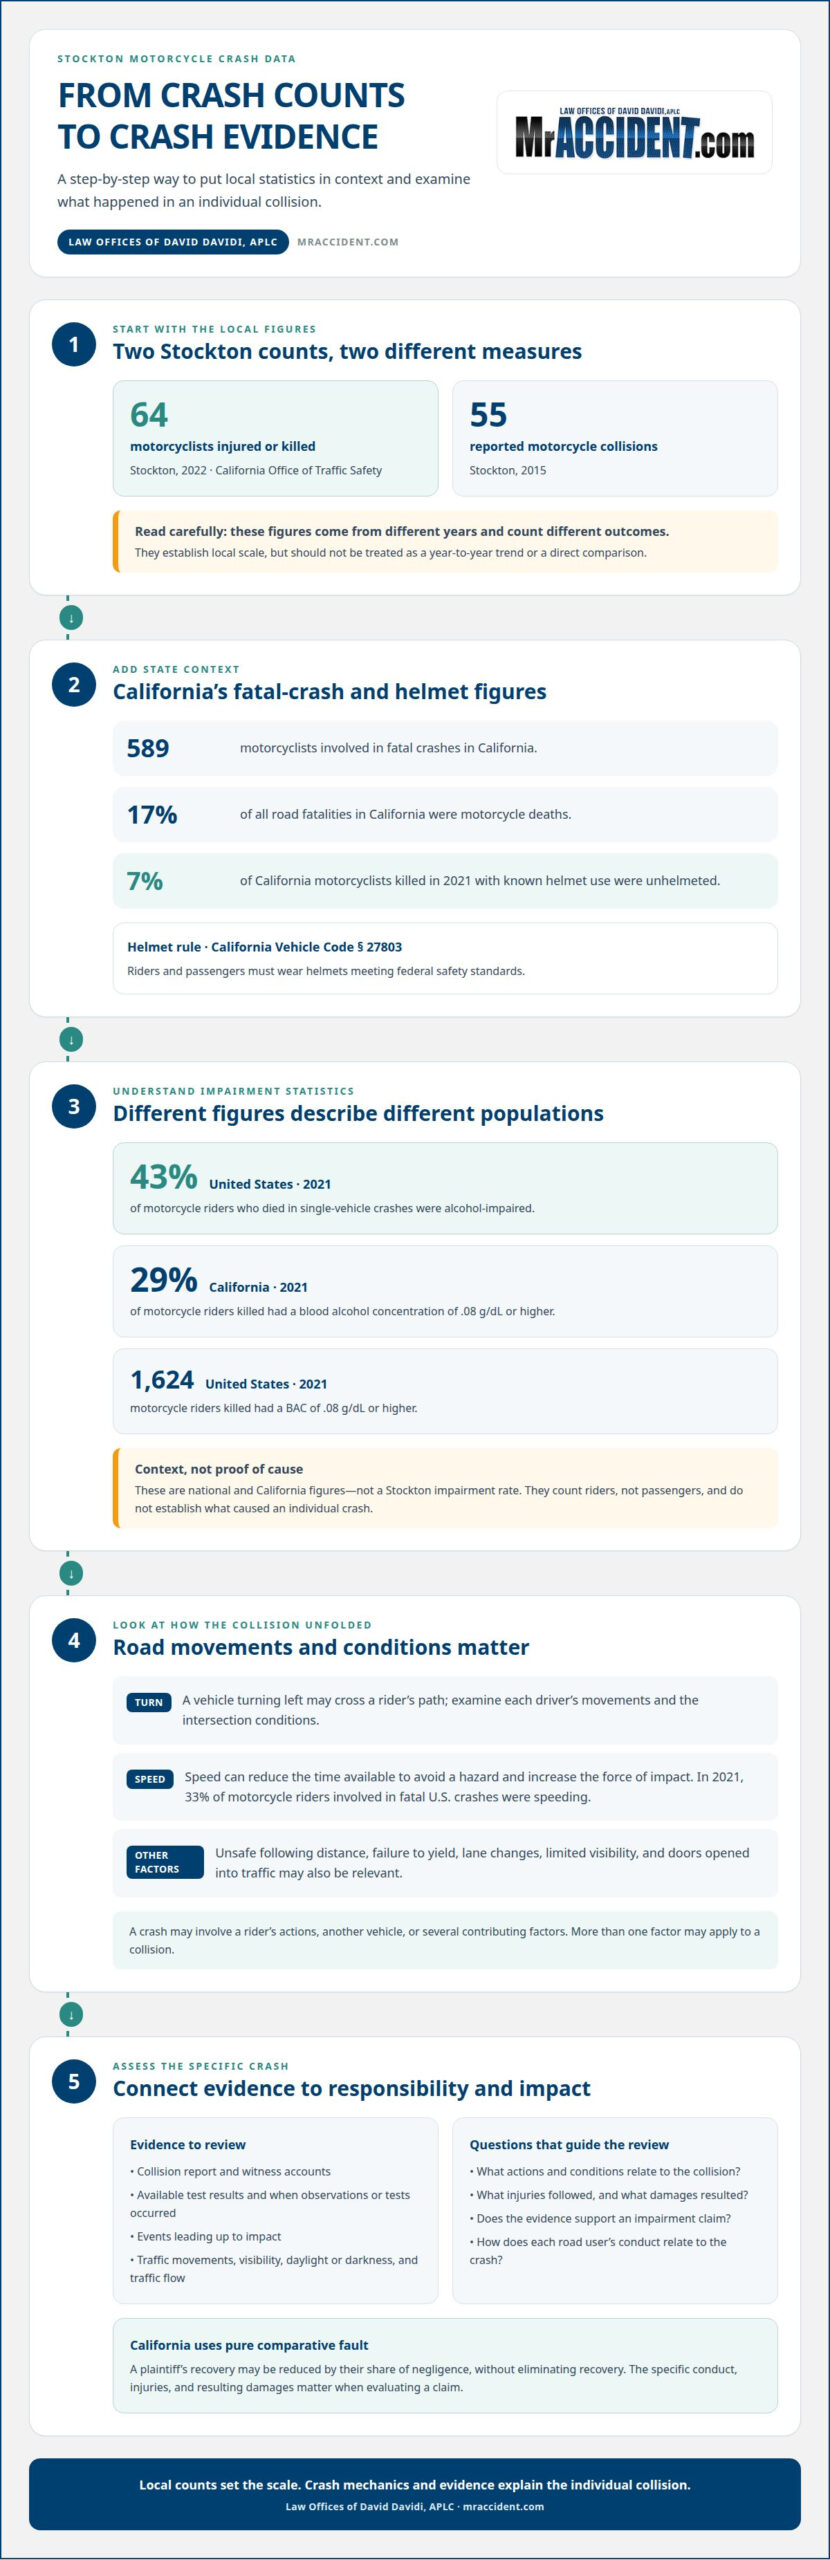
Sixty-four motorcyclists were injured or killed in Stockton in 2022, according to the California Office of Traffic Safety. Stockton motorcycle accident statistics also include 55 reported motorcycle collisions in 2015, but those figures count different things from different years, so they shouldn’t be read as a year-to-year comparison. The numbers establish the local scale, but they don’t explain how crashes happen.
For riders and families, the number of crashes matters, but so does understanding how they happen. This article puts Stockton motorcycle accident statistics in context with California data, explains what alcohol-impairment figures show about motorcycle operators, and describes common crash causes, including left-turn conflicts, speeding, and drivers opening doors into traffic. These patterns can help clarify how a collision unfolded and which circumstances may matter when evaluating responsibility.
Key Takeaways
- Stockton’s crash figures come from different years and measure different outcomes, so compare them carefully rather than treating them as a trend.
- Alcohol impairment is a serious risk factor: 43 percent of U.S. motorcycle riders who died in single-vehicle crashes in 2021 were alcohol-impaired.
- Left turns, unsafe following distances, speeding, and doors opened into traffic are among the collision circumstances riders should understand.
- To assess a crash location, look at the specific traffic movements and conditions involved instead of assuming one road or intersection tells the whole story.
California and Stockton motorcycle crash statistics
Local totals show the scale of crashes; details about how they happened help explain their impact. Compare years and injury outcomes carefully to avoid misleading conclusions.
California and Stockton Crash Patterns
In 2022, 64 motorcyclists were injured or killed in Stockton, according to the California Office of Traffic Safety. The city recorded 55 reported motorcycle collisions in 2015, a different measure from the 2022 injury-and-fatality count. California recorded 589 motorcyclists involved in fatal crashes, and motorcycle deaths accounted for 17% of all road fatalities in the state. Under Vehicle Code section 27803, California Legislative Information says riders and passengers must wear helmets meeting federal safety standards. Helmet protection matters: among California motorcyclists killed in 2021 with known helmet use, 7% were unhelmeted. In a compensation claim, evidence about the driver’s conduct, the rider’s injury, and resulting damages can matter. California’s pure comparative fault system allows recovery to be reduced by a plaintiff’s share of negligence without eliminating it.
Crash-Prone Roads and Intersections
The Stockton totals cited here don’t identify the roads or intersections with the most motorcycle collisions. To understand a specific crash location, focus on the mechanics: turning traffic, lane changes, visibility, and vehicles entering or crossing a rider’s path. In a left-turn collision, for example, consider each driver’s movements and the traffic conditions at the intersection. The location provides context, while the events and available evidence help explain how the crash occurred.
Crash Timing and Seasonal Patterns
The Stockton figures cited here don’t break crashes down by time of day, weekday, or season, so they can’t establish which period has the most accidents. Timing can still help explain an individual collision: daylight, darkness, traffic flow, and visibility affect what road users could see. Review the conditions at the time of the crash rather than assuming a particular day or season caused it.
Affected Age Groups and Demographics
The Stockton totals also don’t identify which age or demographic groups experience the most motorcycle crashes. They count motorcyclists injured or killed, not their personal characteristics. In an individual case, the key questions are how the collision happened, what injuries followed, and what evidence bears on responsibility and damages. Those details are more useful than assigning risk to a group without supporting local data.
Alcohol impairment among motorcycle operators
Alcohol impairment appears in fatal motorcycle crash data, although the figures describe different populations. In 2021, 43 percent of U.S. motorcycle riders who died in single-vehicle crashes were alcohol-impaired. In California that year, 29 percent of motorcycle riders killed had a blood alcohol concentration of .08 g/dL or higher. These statistics show why impairment may matter when examining a serious collision, but they don’t establish what caused any particular crash.
The national count adds context: 1,624 U.S. motorcycle riders killed in 2021 had a BAC of .08 g/dL or higher. This figure counts riders killed, not every operator involved in a crash, and it doesn’t describe Stockton alone. A passenger may also suffer severe injury in a crash involving an impaired operator, but the cited figures measure riders, not passengers.
Alcohol can affect judgment, coordination, and the ability to respond to changing traffic. For a rider, that can make hazards such as a turning vehicle or sudden stop harder to manage. Other actions may also contribute to the same crash, so impairment statistics alone don’t prove who caused an individual collision.
Evidence in a specific crash may include the collision report, witness accounts, available test results, and the events leading up to impact. These details can distinguish an allegation of impairment from documented evidence and show how each road user’s actions relate to the crash. The timing of observations and tests can also affect what they establish.
Stockton’s local crash totals don’t provide a local alcohol-impairment rate for motorcycle operators. California and national figures offer context, not a substitute for examining a Stockton collision. If impairment is raised, the central questions are what evidence supports the claim and whether it connects to the events that caused the crash.
Common causes of motorcycle accidents
A crash may involve a rider’s actions, another vehicle, or several contributing factors. When interpreting Stockton counts for alcohol, speeding, or failure to yield, consider how contributing factors are classified, since more than one may apply to a collision.
Alcohol Involvement
Alcohol impairment can affect judgment and reaction time, making it harder for motorcycle riders to respond to changing traffic. The national figures discussed above describe fatal crashes, not Stockton’s local collision totals, so they shouldn’t be treated as a local rate. For an individual crash, reports, witness accounts, and test evidence can help establish whether impairment was involved and how it related to the collision.
Even if alcohol is suspected, that alone doesn’t show who was responsible. The sequence of events matters: a driver’s turn, a rider’s speed, and visibility may all be relevant. Distinguishing evidence of impairment from evidence about how the crash happened helps clarify potential responsibility and personal injury losses.
Speeding and Failure to Yield
Speed can reduce the time available to avoid a hazard and increase the force of impact. In 2021, 33 percent of motorcycle riders involved in fatal U.S. crashes were speeding. That national statistic isn’t a Stockton count, but it shows why investigators consider speed alongside road conditions and the movements of each vehicle.
California Vehicle Code section 21801 requires a driver turning left to yield to approaching traffic. Section 22350 establishes California’s basic speed law, while section 21703 prohibits following more closely than is reasonable and prudent for speed and road conditions. A driver opening a door into moving traffic must first check that it’s safe under section 22517. These rules help frame questions about conduct; evidence still connects the rule to a particular crash.
Other circumstances can contribute. In 2021, 39 percent of U.S. motorcycle fatalities occurred in darkness, when visibility may affect how riders and drivers detect hazards. A crash review can consider lighting, turning movements, following distance, and the actions each road user took before impact.
Which Stockton roads and intersections have the most motorcycle accidents?
A citywide motorcycle collision total doesn’t show which Stockton road or intersection has the highest count. Identifying a “most dangerous” location requires comparing crashes by exact location and period, not treating a citywide figure as a street-by-street ranking. For a particular crash, the intersection layout and nearby vehicles’ movements offer more useful context.
Start with the exact crash location: the cross street, direction of travel, and point of impact. At an intersection, note whether a vehicle was turning, crossing, merging, or entering from a driveway. For example, a motorcycle traveling straight may collide with a vehicle turning across its path. These details describe the event without assuming that every crash at the location happened the same way.
Conditions at the scene can also help explain what happened. Consider traffic signals or signs, sightlines, lighting, the road surface, nearby entrances, and parked vehicles that affect visibility. Photographs, witness accounts, available video, and the collision report can help establish where each road user was and what happened before impact. A highway segment calls for a different analysis than a signal-controlled intersection, particularly when traffic is moving at different speeds.
To compare locations meaningfully, organize reported crashes by the same time period and location type. Separate intersection collisions from roadway-segment crashes, then consider whether they involved similar movements or conditions. A cluster may point to a recurring conflict, such as turning traffic crossing a rider’s path, but the location alone doesn’t establish fault. Evidence from each collision must show how it occurred.
If you were hurt at a Stockton intersection or on a local roadway, the exact location and crash evidence can help clarify what happened. Discuss your Stockton motorcycle crash and the circumstances surrounding it.
Law Offices of David Davidi, APLC: Motorcycle Accident Legal Representation
Law Offices of David Davidi, APLC represents people injured in motorcycle accidents. If a Stockton crash involved an impaired driver, a disputed turn, or questions about fault, legal representation can help you understand how the evidence relates to liability and your injury losses.
A motorcycle accident claim may require a careful review of the collision report, witness accounts, medical records, and available evidence about road conditions. The firm can assess how those facts relate to potential compensation and explain the legal issues involved. Every case depends on its circumstances, including the conduct of the people involved and the harm caused.
If you’re facing injuries or uncertainty after a motorcycle collision, contact Law Offices of David Davidi, APLC to discuss your situation.
Take the Next Step Toward Clarity
Stockton motorcycle accident statistics offer context, but they can’t explain every detail of an individual collision. If you’re dealing with injuries, uncertainty about responsibility, or questions about losses, a focused review of the crash circumstances can help clarify your options.
Law Offices of David Davidi, APLC provides motorcycle accident legal representation, as well as car and truck accident representation. The next step is a conversation about what happened, the injuries involved, and the questions you need answered. You don’t have to resolve every legal issue before seeking guidance.
Contact Law Offices of David Davidi, APLC to discuss your situation and consider a path forward. You deserve clear information as you decide what comes next.
Frequently Asked Questions
How many motorcycle crashes occur in Stockton, California each year?
The Stockton motorcycle accident statistics cited here include 55 reported motorcycle collisions in 2015. That is a single-year collision count, not an annual average. A separate California Office of Traffic Safety figure counts 64 motorcyclists injured or killed in Stockton in 2022. Since one figure counts collisions and the other counts people harmed, they can’t be combined to estimate yearly crashes or establish a trend.
How many motorcycle accidents in Stockton result in injuries or fatalities?
The cited Stockton figure is 64 motorcyclists injured or killed in 2022, according to the California Office of Traffic Safety. It combines injuries and deaths, rather than separating fatal crashes from nonfatal injuries. A collision can harm multiple people, so the number of people injured or killed may differ from the number of crash events. Keeping those categories separate helps prevent misreading the totals.
What are the latest motorcycle accident statistics for Stockton and San Joaquin County?
The Stockton-specific figure cited here is 64 motorcyclists injured or killed in 2022. Statewide, the California Highway Patrol reports 589 motorcyclists involved in fatal crashes and over 13,000 motorcyclists suffering injuries. Stockton figures describe the city, while San Joaquin County figures would cover a broader area. Keep those geographic boundaries distinct when interpreting local totals or comparing them with statewide counts.
How have motorcycle crash rates in Stockton changed over the past five years?
The cited figures don’t establish a five-year trend because they measure different outcomes in different years: reported collisions in 2015 and people injured or killed in 2022. A fair comparison needs the same measure, geographic boundary, and reporting period for each year. For example, compare annual collision counts with annual collision counts, rather than using injury totals as a substitute for crash events.
What are the leading causes of motorcycle crashes in Stockton?
Common crash mechanisms include impairment, speeding, a driver failing to yield while turning left, following too closely, and a vehicle door opening into traffic. Running a red light or changing lanes unsafely can also contribute. For example, a turning vehicle may cross a rider’s path. In each collision, the evidence must connect a person’s actions to how the crash occurred.
How do Stockton motorcycle accident rates compare with California and national averages?
A direct rate comparison requires matching the location, period, and type of measure. Nationally, motorcyclists accounted for 16.2% of traffic fatalities in 2024, while motorcycles accounted for 3.6% of traffic injuries. California motorcycle deaths made up 17% of all road fatalities. These are shares of broader totals, not direct comparisons with Stockton’s reported collision count or injury-and-fatality figure.

Law Offices of David Davidi, APLC is a California – based Personal Injury Law Firm, our Attorney’s provide the representation for your personal injury, accident, product liability, premises liability, and other
negligence resulting in injuries. We treat all clients and cases, large or small, with hands-on care.
Practice Area
© Copyright 2026 Law Offices of David Davidi, APLC. All rights reserved.
Digital Marketing By 